Graphical Analysis 5.18.3
Free Version
Publisher Description
Graphical Analysis - A tool for science students to collect, graph, and analyze Vernier sensor data.
Graphical Analysis™ is a tool for science students to collect, graph, and analyze data from Vernier sensors.
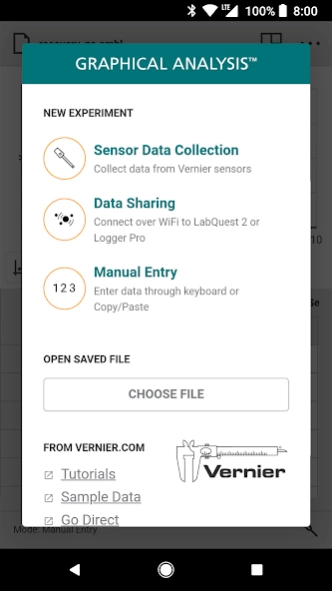
Sensor data-collection support:
• Vernier Go Direct® sensors - with Bluetooth® wireless technology
• Vernier Go Wireless® Heart Rate and Go Wireless Exercise Heart Rate monitors
Additional experiment options:
• Data Sharing via Wi-Fi connection to LabQuest 2, LabQuest 3 or Logger Pro® 3
• Manual Entry
Note: Sensor data collection and Data Sharing require the purchase of hardware from Vernier Software & Technology. Manual entry of data can be performed without a hardware purchase. For more information on Data Sharing, visit http://www.vernier.com/css
Key Features - Data Collection
• Multi-sensor data-collection support
• Time Based, Event Based, and Drop Counting data-collection modes
• Configurable data-collection rate and duration for time-based data collection
• Optional triggering of time-based data collection based on sensor value
• Customizable unit display on supported sensors
• Sensor calibrations
• Option to zero and reverse sensor readings
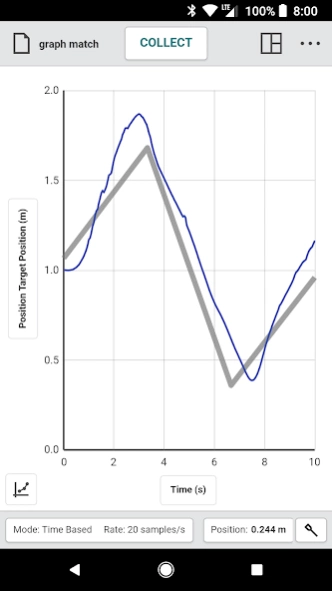
• Graph match feature for use with motion detectors
• Manual entry of data from keyboard and clipboard
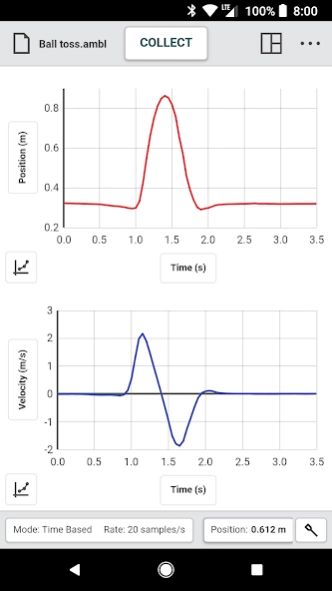
Key Features - Data Analysis
• Display one, two, or three graphs simultaneously
• View data in a table or show a graph and table side-by-side
• Draw Predictions on a graph to uncover misconceptions
• Examine, interpolate/extrapolate, and select data
• Use Tangent tool to show instantaneous rates of change of the data
• Find area under a curve using the Integral tool
• Apply Statistics calculations to find mean, min, max, and standard deviation
• Perform curve fits, including linear, quadratic, natural exponent, and more
• Add calculated columns based on existing data to linearize data or investigate related concepts
Key Features - Collaboration and Sharing
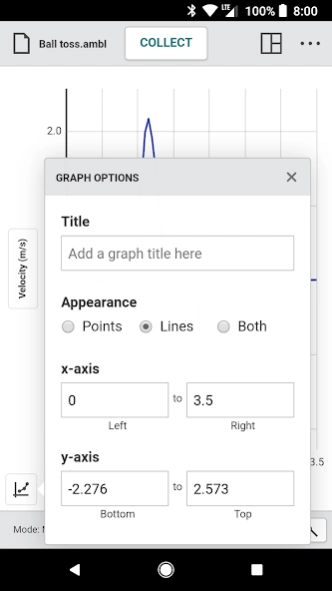
• Create text annotations and add graph titles
• Export graphs and data for printing and inclusion in lab reports
• Save files (.ambl file format) to the Cloud for exchange with Graphical Analysis on other Android™ devices, Chromebooks™, Windows® and macOS® computers, and iOS devices
• Export data in .CSV format for analysis of data in spreadsheet software such as Excel, Google Sheets, and Numbers
• Adjust font sizes for easier viewing when presenting to your class
Vernier Software & Technology has over 35 years of experience in providing effective learning resources for understanding experimental data in science and math classrooms. Graphical Analysis is a part of the extensive system of sensors, interfaces, and data-collection software from Vernier for science and STEM education.
About Graphical Analysis
Graphical Analysis is a free app for Android published in the Teaching & Training Tools list of apps, part of Education.
The company that develops Graphical Analysis is Vernier Software & Technology. The latest version released by its developer is 5.18.3.
To install Graphical Analysis on your Android device, just click the green Continue To App button above to start the installation process. The app is listed on our website since 2023-10-17 and was downloaded 21 times. We have already checked if the download link is safe, however for your own protection we recommend that you scan the downloaded app with your antivirus. Your antivirus may detect the Graphical Analysis as malware as malware if the download link to com.vernier.graphicalanalysis is broken.
How to install Graphical Analysis on your Android device:
- Click on the Continue To App button on our website. This will redirect you to Google Play.
- Once the Graphical Analysis is shown in the Google Play listing of your Android device, you can start its download and installation. Tap on the Install button located below the search bar and to the right of the app icon.
- A pop-up window with the permissions required by Graphical Analysis will be shown. Click on Accept to continue the process.
- Graphical Analysis will be downloaded onto your device, displaying a progress. Once the download completes, the installation will start and you'll get a notification after the installation is finished.
